.png)

Inside many ecommerce brands, the development and deployment of video content captures 99% of the attention and energy. Determining whether it is actually driving outcomes tends to be forgotten.
The analytics are there, including views, watch time, completion rates, but nothing connects those numbers to revenue.
The CFO asks for ROI. The team shows a screenshot of video plays. The program loses budget.
This guide will help brands and marketers close the gap and understand which metrics actually reflect business performance.
What you'll learn:
Video programs that can't prove revenue impact get cut or de-prioritized. If leadership can't connect the dots from video to purchase, then ROI is either a random guess or assumed to be non-existent.
Engagement metrics tell you what visitors did. Commerce metrics tell you what the business results were.
The first category feels good, but only the second justifies continued investment.
A video with 80% completion rate that generates no attributed revenue is a content performance problem waiting to become a budget conversation. Whereas a video with 45% completion rate that drives a 12% purchase rate from engaged visitors is a clear revenue asset.
Most platforms default to engagement reporting because it's what traditional video infrastructure was built to measure. In contrast, connecting a video view to a cart addition to a completed purchase requires infrastructure that generic video platforms weren't designed to provide.
Can your current video platform show CVR for video viewers versus non-viewers on the same page? If not, you can't prove incremental impact, and without that comparison, any ROI number you report will be challenged as correlation, not causation.
Not all video metrics carry equal weight in a budget conversation.
Videowise organizes them into two tiers: revenue attribution metrics that justify continued investment, and engagement metrics that explain why the revenue numbers are moving the way they are.
Here's what each metric tells you and where it sits in the decision-making hierarchy.

A direct sale is when a shopper adds an item from the video player and completes checkout in the same session.
This is the clearest attribution path with no inference required. Videowise tracks this separately from influenced revenue, so teams can distinguish between video-as-closer versus video-as-influencer.
An influenced sale occurs when a shopper watches a video for more than 5 seconds in a session that results in a purchase, even if checkout doesn't originate from the video player.
This captures video's role in the research-and-decide phase of high-AOV purchases, where shoppers rarely convert from the first touchpoint.
Total revenue divided by total video orders (direct and influenced combined).
Brands frequently see AOV lift from video-engaged shoppers because video consumption correlates with deeper product research and higher confidence purchases.
SOSU Cosmetics saw an 8% AOV increase attributed to video engagement, driven by shoppers watching multiple videos and discovering complementary products.
The cohort comparison metric.
Videowise segments visitors who engage with video versus visitors who visit the same page without engaging.
This controls for the selection bias concern that high-intent shoppers self-select into watching video and would have converted anyway.
Without this comparison, aggregate CVR improvements can't be attributed to video with confidence.
These metrics identify problems. They don't prove ROI, but they explain why revenue metrics are moving in a particular direction.
Percentage of page visitors who play the video. Low view rates (under 30%) indicate placement or thumbnail problems, not content problems.
A video that never gets played can't be evaluated on conversion performance.
Average watch time per shopper and the percentage of videos watched in full.
Completion rates above 60% suggest strong content relevance. Drop-off analysis identifies where viewers disengage, which provides direction for content iteration.
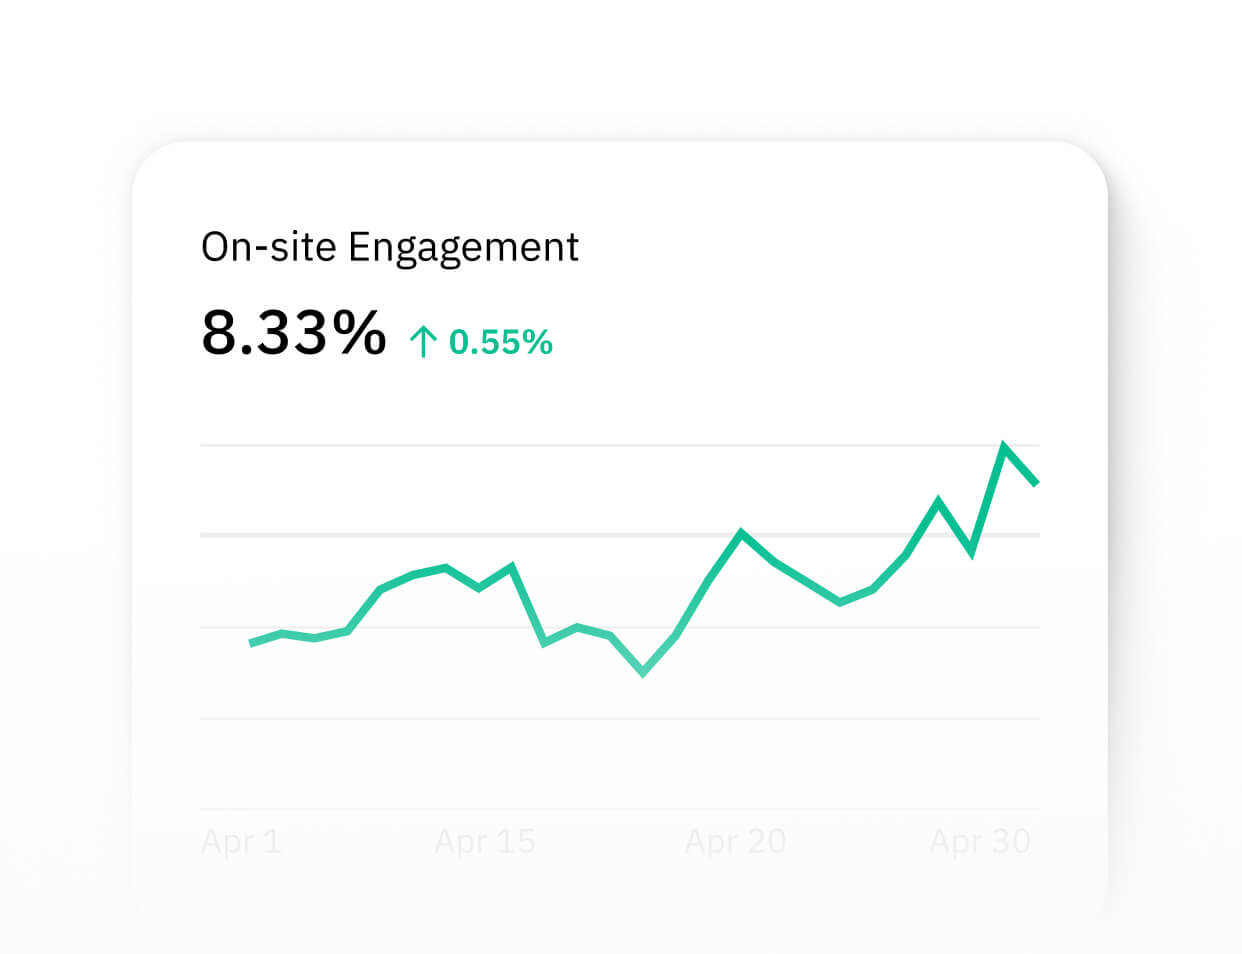
Video's contribution to session duration. Aggregate this across all sessions and it becomes a measure of a video's role in keeping shoppers engaged with the store rather than bouncing to research elsewhere.
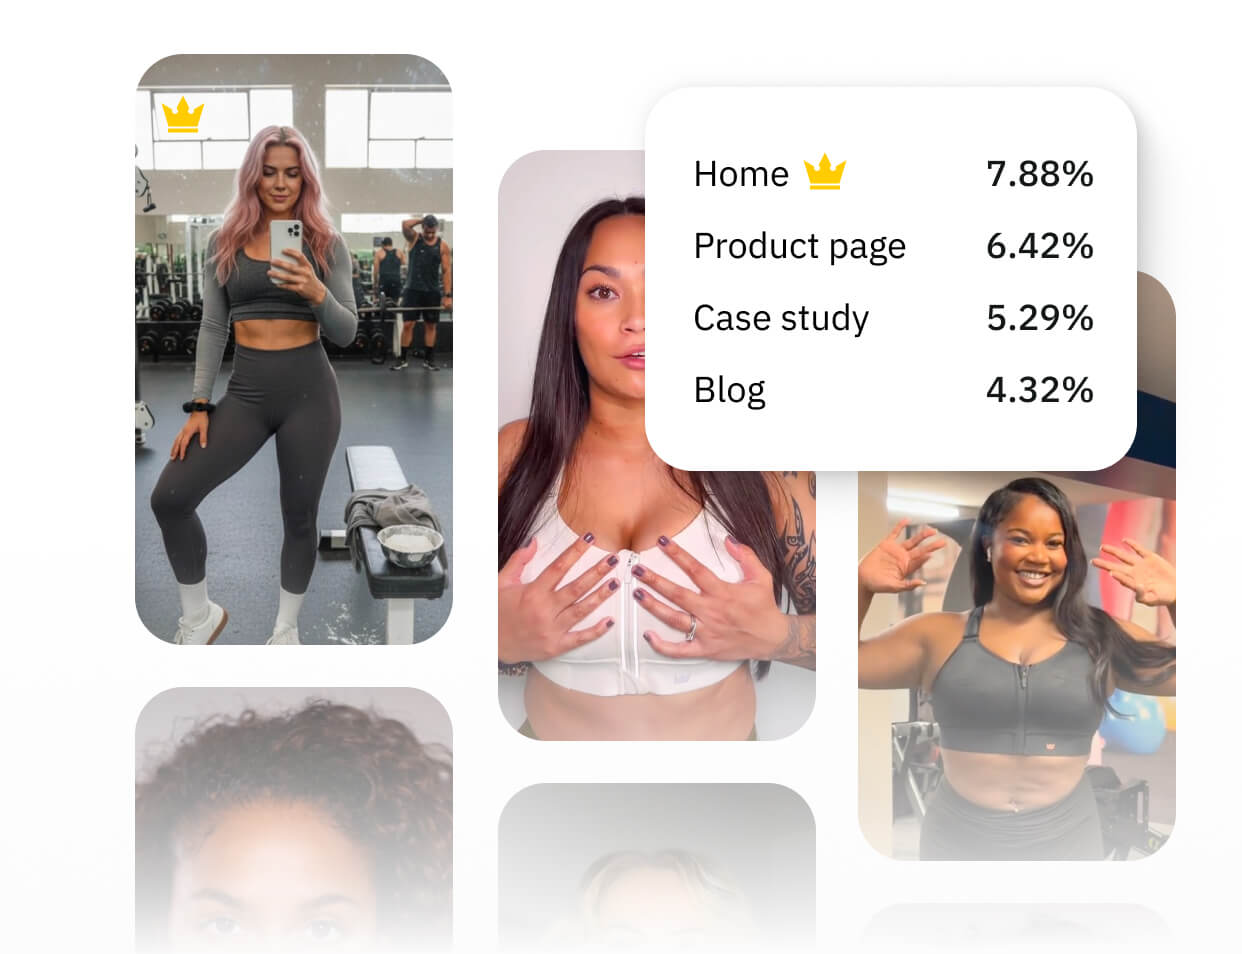
The percentage of visitors who interact with a widget. Differentiates between page traffic and widget reach, which matters when deploying multiple widget types across different page templates.
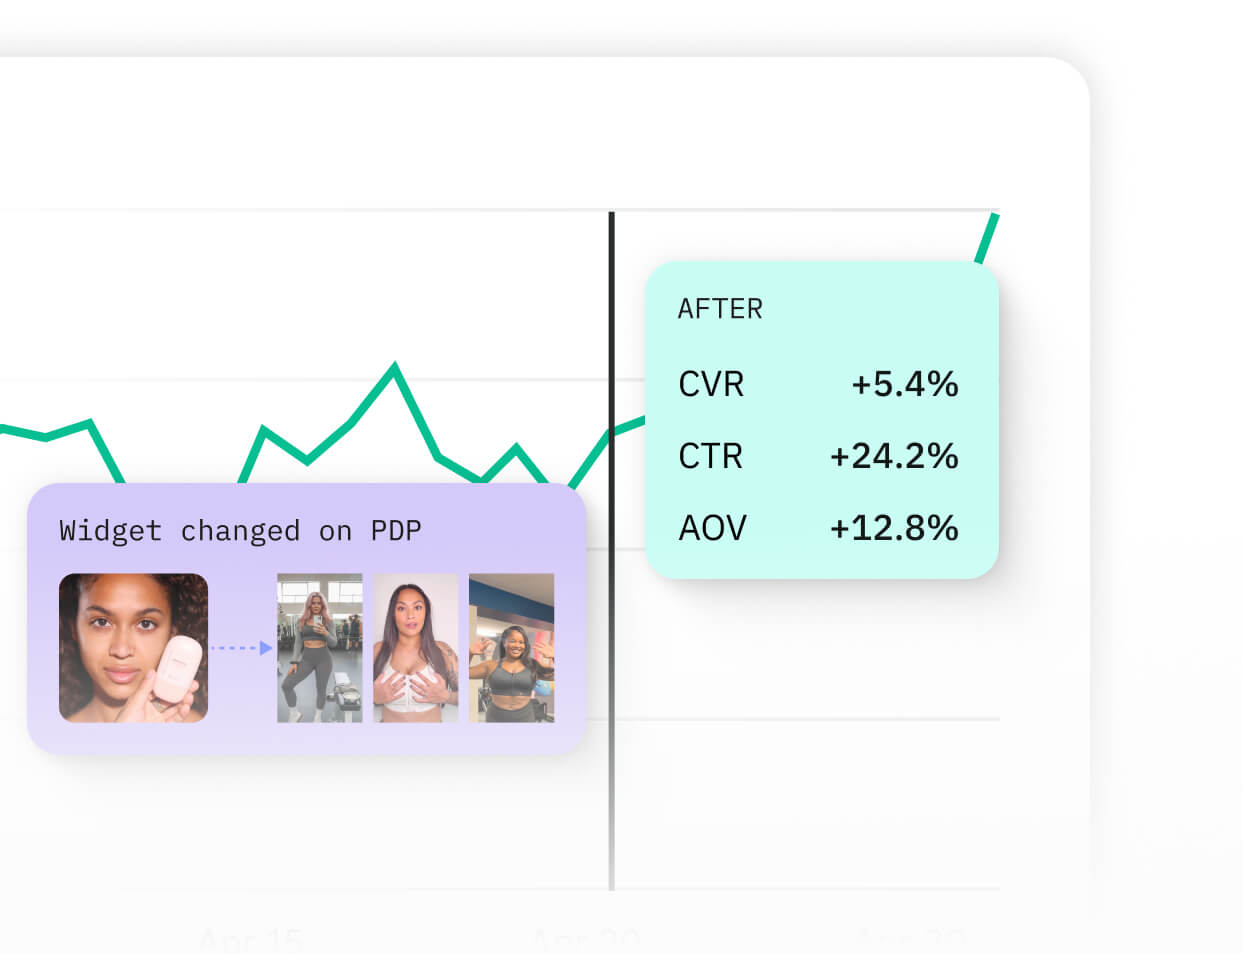
The most defensible attribution model compares two groups of visitors from the same page and time period:
This is NOT site-wide CVR before video versus site-wide CVR after video. That comparison conflates video's impact with seasonal changes, campaign traffic quality, product assortment changes, and dozens of other variables.
The cohort comparison on the same page controls for most of these because both groups experienced the same environment.
Dr. Squatch ran a cohort analysis and found video-engaged visitors converted at 9.9% versus 3.2% for the same-page non-engaged group, a 209% lift that generated $750K+ in attributed revenue.
Without the cohort structure, that gap is invisible in aggregate analytics.
Videowise tracks this natively and surfaces it in the dashboard.
For teams not using a platform with built-in cohort comparison, the setup requires:
Document current performance for any page or page type where video is being deployed before it goes live.
These baselines become the denominator in ROI calculations and the comparison point for stakeholder presentations.
Metrics to capture:
Note: Page speed is not a throw-in metric to benchmark. A slow page costs conversions regardless of content quality, and adding video is a common cause of speed degradation.
Video rarely operates as the single touchpoint in a conversion path. A shopper might see a paid ad, land on a product page, watch a demo video, leave without purchasing, receive an email, return, and then convert. Which touchpoints get credit?
Last-touch attribution undervalues video's research phase role. For high-AOV products where video is most commonly used (luxury apparel fit, beauty application, home goods) video often appears mid-funnel. Last-touch models miss this entirely.
Multi-touch attribution is the accurate model for most video programs.
Videowise attributes video-influenced revenue separately from direct revenue, allowing teams to show both the immediate conversion impact and the research-assist contribution without double-counting.
Practical guidance: Report direct video revenue and influenced video revenue as distinct line items.
Direct revenue shows video as "the closer", meaning the shopper watched and bought in the same session.
Influenced revenue shows video as a research tool, meaning the shopper watched, left, and came back to buy.
Both matter, but conflating them overstates certainty and understates video's role in longer consideration cycles.
Performance varies significantly by vertical, placement, content type, and audience quality.
These benchmarks come from Videowise's customer base and provide directional guidance rather than universal targets.
Standard ROI formula: ROI = (Incremental Revenue - Total Program Cost) / Total Program Cost
Incremental revenue: Revenue from video-engaged cohort minus expected revenue from that cohort at baseline CVR.
Total program cost: Platform subscription + content production costs + team time (hours x hourly rate) + creator/UGC acquisition costs.
Teams consistently undercount content costs. Manual tagging, rights management, and seasonal content updates are hidden time drains.
Examples:
Dr. Dennis Gross had 5,000+ orders worth approximately $1M attributed to video-engaged shoppers, against a platform cost that produced a 328x ROI.
Tushbaby achieved 163.8x ROI over 7 months with $500K+ in video-engaged sales.
Both programs running primarily UGC content, which minimizes production costs.
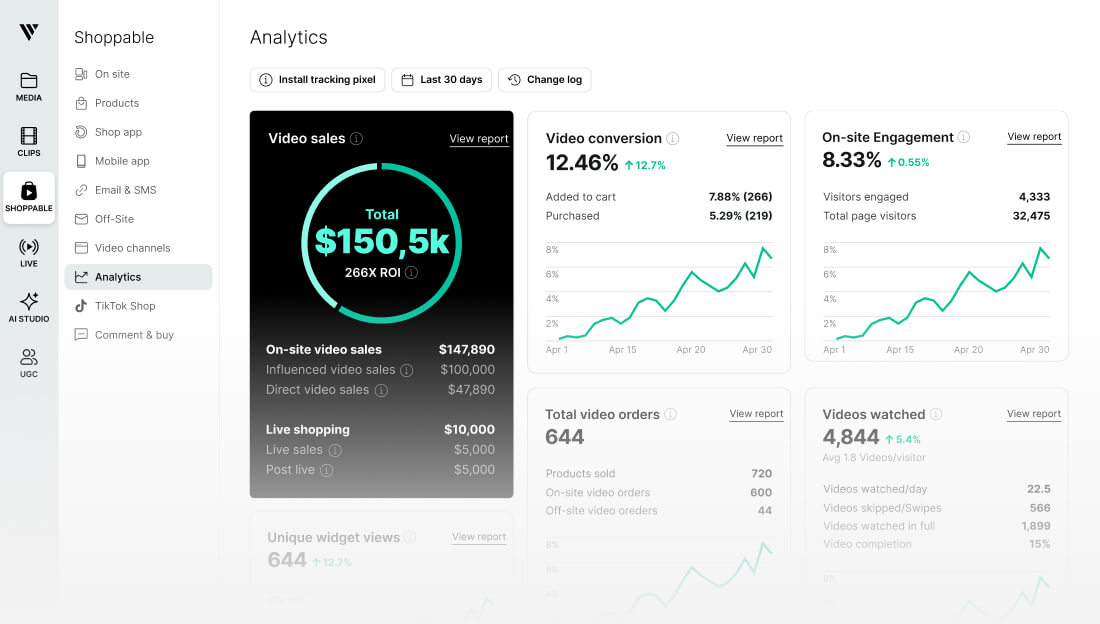
Videowise's analytics dashboard structures data across four primary dimensions: Video, Widget, Page, and Shopper, with an adjustable date range picker on every report page.
The primary dashboard shows metric cards linking to individual report pages:
Shopper metrics provide behavioral context that aggregate metrics don't surface:
Analytics without optimization is just reporting. If the goal is to compound improvement, here's how to translate data into performance changes.
A/B testing at scale tends to require 2-3 weeks to achieve statistical significance. Smaller brands may need even more time than this.
Running multiple simultaneous tests requires careful cohort separation to avoid interaction effects.
Variables worth testing systematically:
Video programs that measure can consistently optimize results.
The iteration cycle:
True Classic deployed video across 700+ product pages without degrading Largest Contentful Paint or Total Blocking Time.
Page speed belongs in the ROI conversation because load time directly affects bounce rate and conversion opportunity. If video deployment slows a page, the CVR lift from video may be partially offset by the CVR loss from degraded performance.
This is a calculation most teams DON'T run, but can severely impact results.
Videowise's lightweight implementation is designed to prevent this tradeoff, but most video platforms will slow down page speed to one degree or another.
Two weeks provide the minimum data for directional conclusions.
At this point:
Measuring too soon
Statistical significance at typical Shopify traffic volumes requires several weeks, minimum. Brands with 50,000+ monthly sessions on video-enabled pages may hit significance faster.
Ignoring assisted conversions
Video often assists mid-funnel but doesn't receive last-touch credit in default attribution setups. Videowise's influenced revenue tracking captures video's research-phase contribution that last-touch models miss.
Attributing all page revenue to video
A video-enabled page has both video-engaged and non-engaged visitors. Using total page revenue rather than the video-engaged cohort's revenue inflates the attribution claim and invites legitimate challenge from finance.
Not tracking return rates
A 10% CVR from video-engaged visitors who then return the product at high rates is worse than an 8% CVR with strong retention. Return rate by cohort (video viewers vs. non-viewers) belongs in the measurement framework.
Comparing unlike pages
PDPs with video typically have higher-intent traffic than collection pages. Comparing video performance on PDPs to non-video performance on collection pages produces meaningless data. Control for page type in all cohort comparisons.
Explore how Videowise tracks direct and influenced video revenue, runs cohort comparisons natively, and surfaces the data your finance team needs to see. Browse customer stories from brands across beauty, apparel, and gear, or book a demo to see how the analytics work for your store.
The range is wide because it reflects catalog size, traffic volume, content quality, and how well video matches the primary purchase barrier for each product category. Dr. Dennis Gross achieved 328x ROI in 2023 with 150+ pages embedded. Tushbaby reached 163.8x over 7 months. Nomad the Label hit 430x in a 30-day period. Most brands see positive ROI within 60 days. Programs with high-quality UGC libraries and high-traffic PDPs tend to compound faster.
Videowise tracks at the session level, capturing both direct video purchases (video player to cart to checkout) and influenced purchases (video view plus purchase within the same session). Cross-device attribution across sessions uses Shopify's customer identity when shoppers are logged in. For anonymous visitors across devices, the platform applies standard session-based attribution consistent with how Shopify reports conversion data.
CVR lift (video viewers vs. non-viewers) is the primary business metric. View rate is diagnostic. A 20% view rate with 15% CVR lift is more valuable than a 60% view rate with no measurable CVR difference. When view rate is low, address it first because conversion analysis on video content that isn't being watched isn't meaningful. But the optimization goal is always the revenue cohort comparison.
The cohort comparison framework addresses this directly. Non-engaged visitors on the same page are the control group. If video-engaged visitors convert at higher rates than the control group, the incremental lift can't be explained by organic intent differences alone since both cohorts had access to the same page, the same product, and the same price point. The only variable was video engagement.
Videowise uses first-party data tracked directly on your own domains, not third-party cookies. This means attribution persists regardless of browser privacy changes or iOS tracking restrictions. It's a structural advantage over ad-platform attribution models, where iOS changes since 2021 have left many teams unable to prove paid media ROI with confidence. On-site video analytics don't share that vulnerability.
Why Measurement Infrastructure Determines Program Outcomes
What to Measure: Commerce Metrics vs. Engagement Metrics
How to Build Measurement Infrastructure
Benchmarks: What Good Video ROI Looks Like
The Videowise Analytics Walkthrough
Optimizing for Better Performance


.jpg)

.jpg)