As customer acquisition costs (CAC) continue to climb, Shopify operators are under immense pressure to squeeze more value from every session. Traditional static product pages often hit a conversion ceiling, leaving growth managers searching for ways to bridge the gap between discovery and purchase. Live commerce has emerged as the most effective solution for this problem, blending real-time social interaction with instant checkout. At Videowise, we focus on helping brands turn these video interactions into measurable revenue through a shoppable video platform. This guide breaks down the essential live commerce statistics you need to justify your 2026 roadmap and optimize your video strategy for maximum ROI. By understanding these benchmarks, you can move beyond vanity metrics and focus on what truly drives scale: conversion rate (CVR) and average order value (AOV).
The live commerce market is no longer a localized trend or an experimental channel for early adopters. It has matured into a foundational component of the modern omnichannel retail stack. In 2026, global livestream sales are projected to exceed $1 trillion, representing a massive shift from the $682 billion benchmark seen just a few years ago.
The rapid adoption of this format is driven by a fundamental change in how consumers expect to interact with brands. Operators are shifting away from passive video consumption and moving toward interactive, revenue-focused experiences. In mature markets like China, livestreaming already accounts for nearly 20% of all retail ecommerce sales. This level of penetration suggests that live commerce is not just an additive channel but a replacement for traditional search-and-browse shopping habits.
While Asia continues to lead in total volume, North America and Europe are seeing the fastest year-over-year growth in 2026. This growth is fueled by the integration of shoppable features into platforms like TikTok Shop and YouTube Shopping, alongside a push for on-site live events that brands can fully own. For a brand example of this model, see Andar's live shopping case study. For a growth manager, these numbers prove that live commerce is a required competency for any brand looking to maintain market share.
Quick Answer: Live commerce is projected to be a $2.47 trillion global industry by 2033, with 2026 acting as a critical tipping point for Western adoption. It offers conversion rates up to 10x higher than traditional ecommerce by combining real-time engagement with immediate checkout.
The most compelling argument for live commerce isn't engagement; it is the immediate impact on the bottom line. Operators focus on three primary metrics: Conversion Rate (CVR), Average Order Value (AOV), and Revenue Per Session (RPS).
Standard ecommerce conversion rates typically hover between 2% and 3% for most Shopify brands. In contrast, live commerce events regularly report conversion rates between 9% and 30%. This performance gap is due to the reduction of friction. When a shopper can see a product demonstrated live and ask questions in real-time, the "uncertainty gap" disappears.
Live shopping events are uniquely suited for upselling and cross-selling. Because hosts can show how products work together—such as a skincare routine or a complete outfit—shoppers are more likely to add multiple items to their cart. Statistics show that live commerce events can increase AOV by 12% to 15%. When brands integrate "Buy Now, Pay Later" (BNPL) services into the live stream, that lift can jump by an additional 25%.
RPS measures the total revenue generated divided by the number of sessions. Because live commerce keeps users on the page longer and converts them at a higher rate, the RPS for video-driven sessions is significantly higher than for static image sessions. Operators using high-performance video commerce infrastructure often see a consistent lift in RPS across their most important collection pages and PDPs (Product Detail Pages).
Key Takeaway: Live commerce isn't about "likes" or "views." It is a high-velocity sales channel that drives a 3x to 10x increase in CVR compared to traditional storefront browsing.
The success of your live commerce strategy depends heavily on your target market's maturity. The statistics show a clear divide between "pioneer" markets and "growth" markets.
China remains the blueprint for live commerce success. By 2026, the market size in China is expected to cross $1.1 trillion.
The US market is in a period of rapid acceleration. While only 12% of US shoppers have made a live purchase previously, that number is expected to double by the end of 2026.
Europe shows a more fragmented adoption curve, with 35% of consumers having engaged with live commerce, primarily in the fashion and beauty sectors. Latin America is emerging as a powerhouse, particularly in Brazil, where shoppers spend nearly four hours a day on social media—the highest in the world. This high social engagement makes Latin American markets prime territory for integrated shopping feeds.
Where you host your live events determines your level of control and your data ownership. Operators generally split their efforts between social platforms and their own ecommerce sites.
TikTok, Instagram, and Facebook continue to dominate the discovery phase, which is where social commerce workflows matter most.
Forward-thinking brands are increasingly moving live events to their own Shopify storefronts. This allows them to own the customer data and avoid the high commission fees (often 40%+) charged by top-tier social influencers. For the live infrastructure behind that model, see Videowise's live shopping platform.
Understanding the "who" behind the statistics helps in tailoring the content of your live streams.
Not every product category performs the same in a live environment. The statistics show that categories requiring demonstration or high visual appeal see the best results.
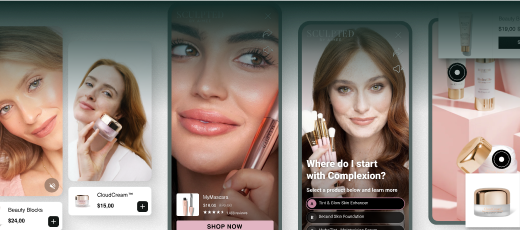
Fashion and beauty remain the undisputed leaders. Live try-ons, makeup tutorials, and fabric close-ups solve the biggest pain point in online fashion: "Will this look good on me?" A beauty example is WONDERSKIN's shoppable-video case study.
Bottom line: If you are in fashion or beauty, live commerce is no longer optional; it is the primary conversion driver for your category.
These categories benefit from the "de-risking" power of live video. Seeing a vacuum cleaner's suction power or the interface of a new smart home device in real-time reduces buyer hesitation. Return rates for electronics are significantly lower when the product is purchased through a live demo compared to a static page.
In China, food is the highest-penetrating sector for live commerce at 30%. In the West, we are seeing a rise in "grocery live streams" and specialty food creators who sell directly through live tastings.
A common concern among ecommerce directors is that adding video will slow down their site. This fear is backed by data: a one-second delay in page load time can result in a 7% drop in conversions.
However, the "performance-first" infrastructure used by modern platforms has solved this problem. At Videowise, we ensure that adding shoppable video or live streams doesn't harm your Core Web Vitals (the metrics Google uses to measure page speed and user experience). For a closer look at the measurement layer, explore video performance analytics.
What to look for in live commerce tech:
Myth: Video always slows down your site. Fact: Using optimized, performance-first video infrastructure allows you to maintain fast load times and healthy Core Web Vitals while increasing engagement.
Based on the 2026 data, operators should follow a phased approach to scaling their video operations.
Step 1: Audit Your Content Look at your existing UGC (User Generated Content) and social videos. You don't always need a high-production live event to start. If you're just getting started, this shoppable video guide shows how brands can turn existing clips into purchase-ready experiences. Import your best-performing TikToks or Instagram Reels onto your PDPs as shoppable videos.
Step 2: Test Merchant-Led Streams Before hiring expensive influencers, have your internal team or founder run a live session. Use these sessions to answer common customer service questions and show off product features.
Step 3: Optimize for Mobile Since 60% of all ecommerce is now mobile, your live commerce experience must be vertical and mobile-first. Ensure the "Add to Cart" button is easily reachable with a thumb.
Step 4: Analyze Influenced Revenue Use analytics to track not just direct sales during the stream, but also "influenced revenue"—shoppers who watched the stream and bought later that day. For a deeper breakdown, read how to track shoppable video performance.
As we move through 2026, two technologies are fundamentally changing the live commerce landscape: AI and AR.
AI-Powered Personalization AI is now being used to create personalized product recommendations within the live chat. If a shopper asks about a specific skin type, the AI can instantly surface the correct product tag for them, even if the host is busy talking about something else. See how Videowise's AI video creation studio helps teams produce product videos without heavy production overhead.
AR (Augmented Reality) Integration Virtual try-ons are being integrated directly into live streams. A viewer can "try on" a pair of sunglasses or a shade of lipstick while watching the host demonstrate it. This immersive experience is projected to drive another 10% to 20% lift in conversion rates for the brands that adopt it early.
The live commerce statistics for 2026 make one thing clear: the gap between entertainment and commerce has closed. For Shopify operators, this is the most significant opportunity to improve conversion rates and AOV in a decade. By moving from static pages to interactive, video-driven experiences, you can provide the clarity and confidence shoppers need to click "buy."
Our mission at Videowise is to provide the infrastructure that makes this transition possible without compromising on performance. We help you turn every video asset into a measurable revenue channel, ensuring your site stays fast while your sales grow.
Next Steps for Operators:
To see how video commerce can drive measurable revenue for your brand, book a demo with our team.
While standard ecommerce conversion rates are typically 2-3%, live commerce events regularly see conversion rates between 9% and 30%. In high-intent categories like fashion and beauty, some brands report conversion rates as high as 70% during peak live events.
Yes, live commerce typically increases AOV by 12% to 15%. This is because hosts can effectively demonstrate product bundles and cross-sell related items in real-time, encouraging shoppers to purchase complete sets rather than individual products.
The 25-34 age group is the most active demographic, accounting for approximately 28% to 30% of all live commerce purchases globally. However, the 45-60 demographic is also a significant contributor in Western markets, representing about 25% of total sales.
Not if you use performance-first infrastructure. Modern platforms use techniques like viewport loading and optimized CDNs to ensure that video content only loads when needed, maintaining your site's speed and Core Web Vitals while delivering a high-quality stream.