
Gearing up for another roller-coaster year of dynamic trends, evolving customer expectations, and an upward revenue curve?
We’ve curated over 50 crucial data points to give all eCommerce business owners and marketers a sense of what 2024 holds for them. Use these research signals to carve your strategy for unprecedented growth and reach more shoppers.
You’ll also find actionable advice and key takeaways to hit the ground running. So, put on your thinking hats and get to the whiteboard to start planning!
We spent hours studying the latest research reports and surveys from the world of eCommerce to find what’s in store for you in 2024. Here are 50+ eCommerce statistics to help you make informed decisions and move the needle for your business.
Is the eCommerce industry headed for a recession? Or can online merchants expect a spike in revenue? Several studies signal a positive year ahead for those in the eCommerce sector. Things are looking up as shoppers across different parts of the world are willing to spend more.
Here’s a glimpse of the most crucial data points to think about in your eCommerce strategy:
.webp)
5. The pet care vertical was the fastest-growing category across the sector at a rate of 11.2%. This was followed by the snacking niche at 10.8% and the ambient food sector at 7.7%. (NIQ)
6. Ad spending by eCommerce businesses will have an estimated value of $38.4 billion in 2024. This has more than tripled since 2019, when it was $12.5 billion. (Semrush)
7. 40% of eCommerce businesses struggled with rising costs as the biggest challenge in their operations. (Metapack)
.webp)
8. India saw the biggest increase in eCommerce web traffic between 2022 and 2023. The total traffic for online stores reached 8.43% in 2023. (Semrush)
9. China-based AliExpress witnessed the largest year-over-year growth in 2023, with a 44% increase. This was followed by Amazon and Walmart. (Semrush)
10. Over 70% of businesses globally are also prepared for a potential recession in 2023. As a result, these sellers took various precautionary measures like price adjustments and operational changes. (Shopify)
.webp)
If you're driving decent traffic to your online store, but the conversion rates remain disappointing, it's likely because of poor website UX.
Savvy shoppers expect a frictionless experience when shopping online. They're ready to bounce at the slightest inconvenience—be it limited payment options, confusing layouts, slow-loading sites, or unappealing design. ****
-1.webp)
💡Read more: Elevate eCommerce Customer Experience with Industry Experts
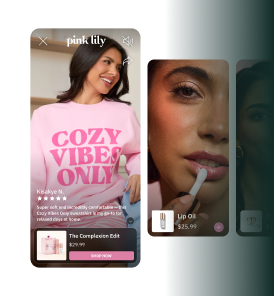
Today’s shoppers trust user-generated content more than ever. They want to see your products in action and hear from actual customers to make confident buying decisions. It’s time to embrace customer advocacy and nudge happy consumers to spread the word.
Word-of-mouth marketing has a new name, and it’s UGC.
.webp)
8. 78% of buyers feel more confident making a purchase when they UGC for a brand. 35% rely on UGC more than ever to shop selectively in a challenging economy. (Bazaarvoice)
9. 43% of shoppers in the US, especially from the younger age groups, want to consume more UGC before making a buying decision. (Bazaarvoice)
.webp)
10. Placing UGC content on product pages can be a game-changer for eCommerce businesses. Nearly 3 in 4 buyers trust UGC more than branded content on product pages. (Bazaarvoice)
11. 55% of shoppers claim they don’t buy a product without first seeing some content from existing customers of the brand. (Bazaarvoice)
12. 78% of customers consider reviews as the number one deciding factor before buying anything. 77% believe Q&As are the most important aspect to consider. (Bazaarvoice)
13. Seeing high-quality customer reviews within the first 20 seconds of landing on a product page has a 21% chance of convincing shoppers to buy. (Bazaarvoice)
14. A few other elements on your product page to influence buying decisions include:
1.Average star ratings (19%)
2.Number of reviews (13%)
3.Details in the review (13%)(Bazaarvoice)
15. Shoppers expect user-generated content to tell them about the value for money (62%), the quality of products(50%), and whether the product matches the description (44%). (Bazaarvoice)
.webp)
16. 83% of shoppers want to see a combination of branded photos and customer photos to make a confident buying decision. (Bazaarvoice)
17. A vast majority of shoppers (73%) want to see branded videos on product pages, while 69% want to see shopper videos. (Bazaarvoice)
.webp)
💡Read more: How to Use UGC Videos for your eCommerce store
The key to unlocking greater brand loyalty and higher sales is delivering a seamless experience across the board. Whether customers want to buy on social platforms, your website, or in-store, you have to give them a coherent experience everywhere.
These effortlessly fluid shopping experiences allow consumers to go from discovery to purchase and repeat purchase without friction.
💡Read more: 25 Omnichannel Retail Examples for eCommerce Businesses
eCommerce brands need to step up their influencer marketing game to reach a bigger, wider audience. Influencer and creator collaborations open up the gateway to a niche audience and boost brand awareness. Plus, shoppers are more likely to take recommendations from a trusted influencer or creator than your brand.
.webp)
4. 70% of creators and influencers consider long-term partnerships the best. To build stronger relationships with brands, 52% of them want to work with brands that have brand ambassador programs. (Aspire)
5. 83% of influencers agree to work with brands simply in exchange for their products—if the product value is high or they love the brand. (Aspire)
6. 68% of brands increased their influencer marketing budgets in 2023. A year ago, brands spent an average of 25% of their marketing budgets on influencers. (Aspire)
7. A majority of marketers (68%) are looking to launch campaigns on TikTok. But 45% also want to create content on YouTube. (Aspire)
💡Read more: How to Find Creators for UGC Video Content
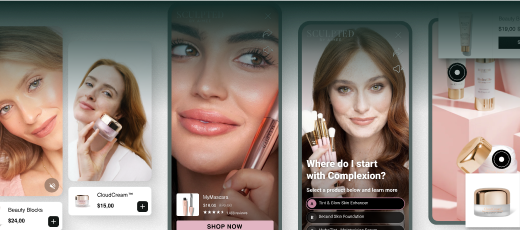
Social commerce is quickly becoming the norm, offering the convenience of directly shopping on the platform. Instead of browsing endlessly through a website, shoppers can simply watch a shoppable video, learn more about the product, and place an order. It’s all at their fingertips on a mobile screen!
.webp)
3. 80% of consumers on TikTok claim that the platform helps them discover new products and brands. (TikTok)
4. More than half (56%) of consumers rely on mobile phones almost always or frequently to research before making a purchase. (PWC)
5. Shoppers spend 26% of their buying process on social media to discover and learn more about a product or brand. They divide this time between site searches (38%) and organic searches (49%). (Bazaarvoice)
6. Every 4 in 10 shoppers use their phones while they’re inside a store and want to find more information about a product or compare it to other brands. (PWC)
7. 36% of shoppers compare the prices of a product to a competing brand while they’re standing in front of it in a physical store. (PWC)
8. 58% of shoppers claim to discover a brand through social media. 49% of them say they’re more likely to find products/services on social platforms than other channels. (Bazaarvoice)
9. 31% of shoppers respond positively to targeted advertising on phones. Among Gen Z shoppers, this number is nearly half (43%). (PWC)
10. 9 in 10 people buy from brands they follow on social media channels. (Shopify)
11. Brands using social media to win new customers and maximize retention attribute 29% of their total sales to social commerce. (Aspire)
.webp)
💡Read more: Elevate Your BFCM eCommerce Strategy With Interactive Video
That's a wrap-up of our handpicked data points on how the world of eCommerce will change in the coming year. Now it's your turn to define new tactics to drive growth and boost sales in 2026.
If you’re planning to double down on video marketing, read our case studies to learn how industry-leading brands succeeded with video.
Key data points for 2026 include the eCommerce sector surpassing $6 trillion in 2023 and projected to exceed $6.8 trillion in 2024, with continued upward growth expected. Consumer willingness to spend online is increasing globally, making it a strong environment for merchants who invest in optimization, video, and personalization strategies.
eCommerce statistics give you a data-backed foundation for prioritizing your investments. Instead of guessing which tactics to focus on, you can use industry benchmarks to identify where the biggest opportunities lie, such as mobile commerce growth, video adoption rates, or shifting customer expectations, and allocate your budget and effort accordingly.
Research consistently shows that video is one of the highest-impact channels in eCommerce. Consumers who watch product videos are significantly more likely to purchase, and the majority of online shoppers say video helps them make more confident buying decisions. Brands investing in video marketing see measurable improvements in conversion rates and customer engagement.
Start by benchmarking your current metrics against industry averages to identify gaps. Use data on cart abandonment rates, average order value, and conversion benchmarks to prioritize where improvements will have the most impact. Pair this with trend data to ensure your strategy is aligned with where shopper behavior is heading, not just where it has been.
The trends with the strongest data backing for 2026 include live commerce and shoppable video adoption, mobile-first shopping experiences, AI-powered personalization, the continued rise of social commerce on TikTok and Instagram, and growing consumer demand for authentic content like UGC over polished brand advertising.
50+ eCommerce statistics to shape your strategy for 2024
Market outlook: What does 2024 have in store for you?
User experience: Your website UX can make or break the deal
User-generated content (UGC): Make your customers the face of your brand
Omnichannel experiences: Meet shoppers where they are
Influencer and creator marketing: Build long-term partnerships
Social commerce & mobile shopping: Take shopping beyond your website


.jpg)

.jpg)