
You’ve spent the last several weeks planning every detail of your BFCM campaign.
From deciding the best deals to making head-turning marketing collateral, you've hustled for days and nights to make this year's sale a hit!
Now that the peak shopping weekend is so close, it’s time to bring it home and seal your success with the right BFCM KPIs.
But the truth is that 63% of eCommerce businesses don’t track the right BFCM metrics.
You're simply shooting in the dark without good performance indicators. A targeted set of metrics helps you monitor every aspect of your campaigns and identify what's bringing the best ROI. Not just that, it's also critical to prepare for the year-end retail holidays with data-driven decisions.
We’ve created this exhaustive guide to discuss the most game-changing BFCM KPIs you should track for long-term success.
Let’s break down the nine top Black Friday metrics you should consider tracking this holiday season.
Your website traffic is one of the most critical links in the BFCM chain. When analyzing website traffic, you should answer questions like:
You can use behavior flow analysis to understand how users navigate through your site. Run a page speed optimization test to fix issues related to page loading time.
On top of that, assessing different website traffic sources can also reveal your top-performing marketing channels. You can double down your investment on the right channel(s) to multiply these traffic numbers and eventually maximize conversions.
These insights will help you optimize the website UX and make the shopping experience seamless.
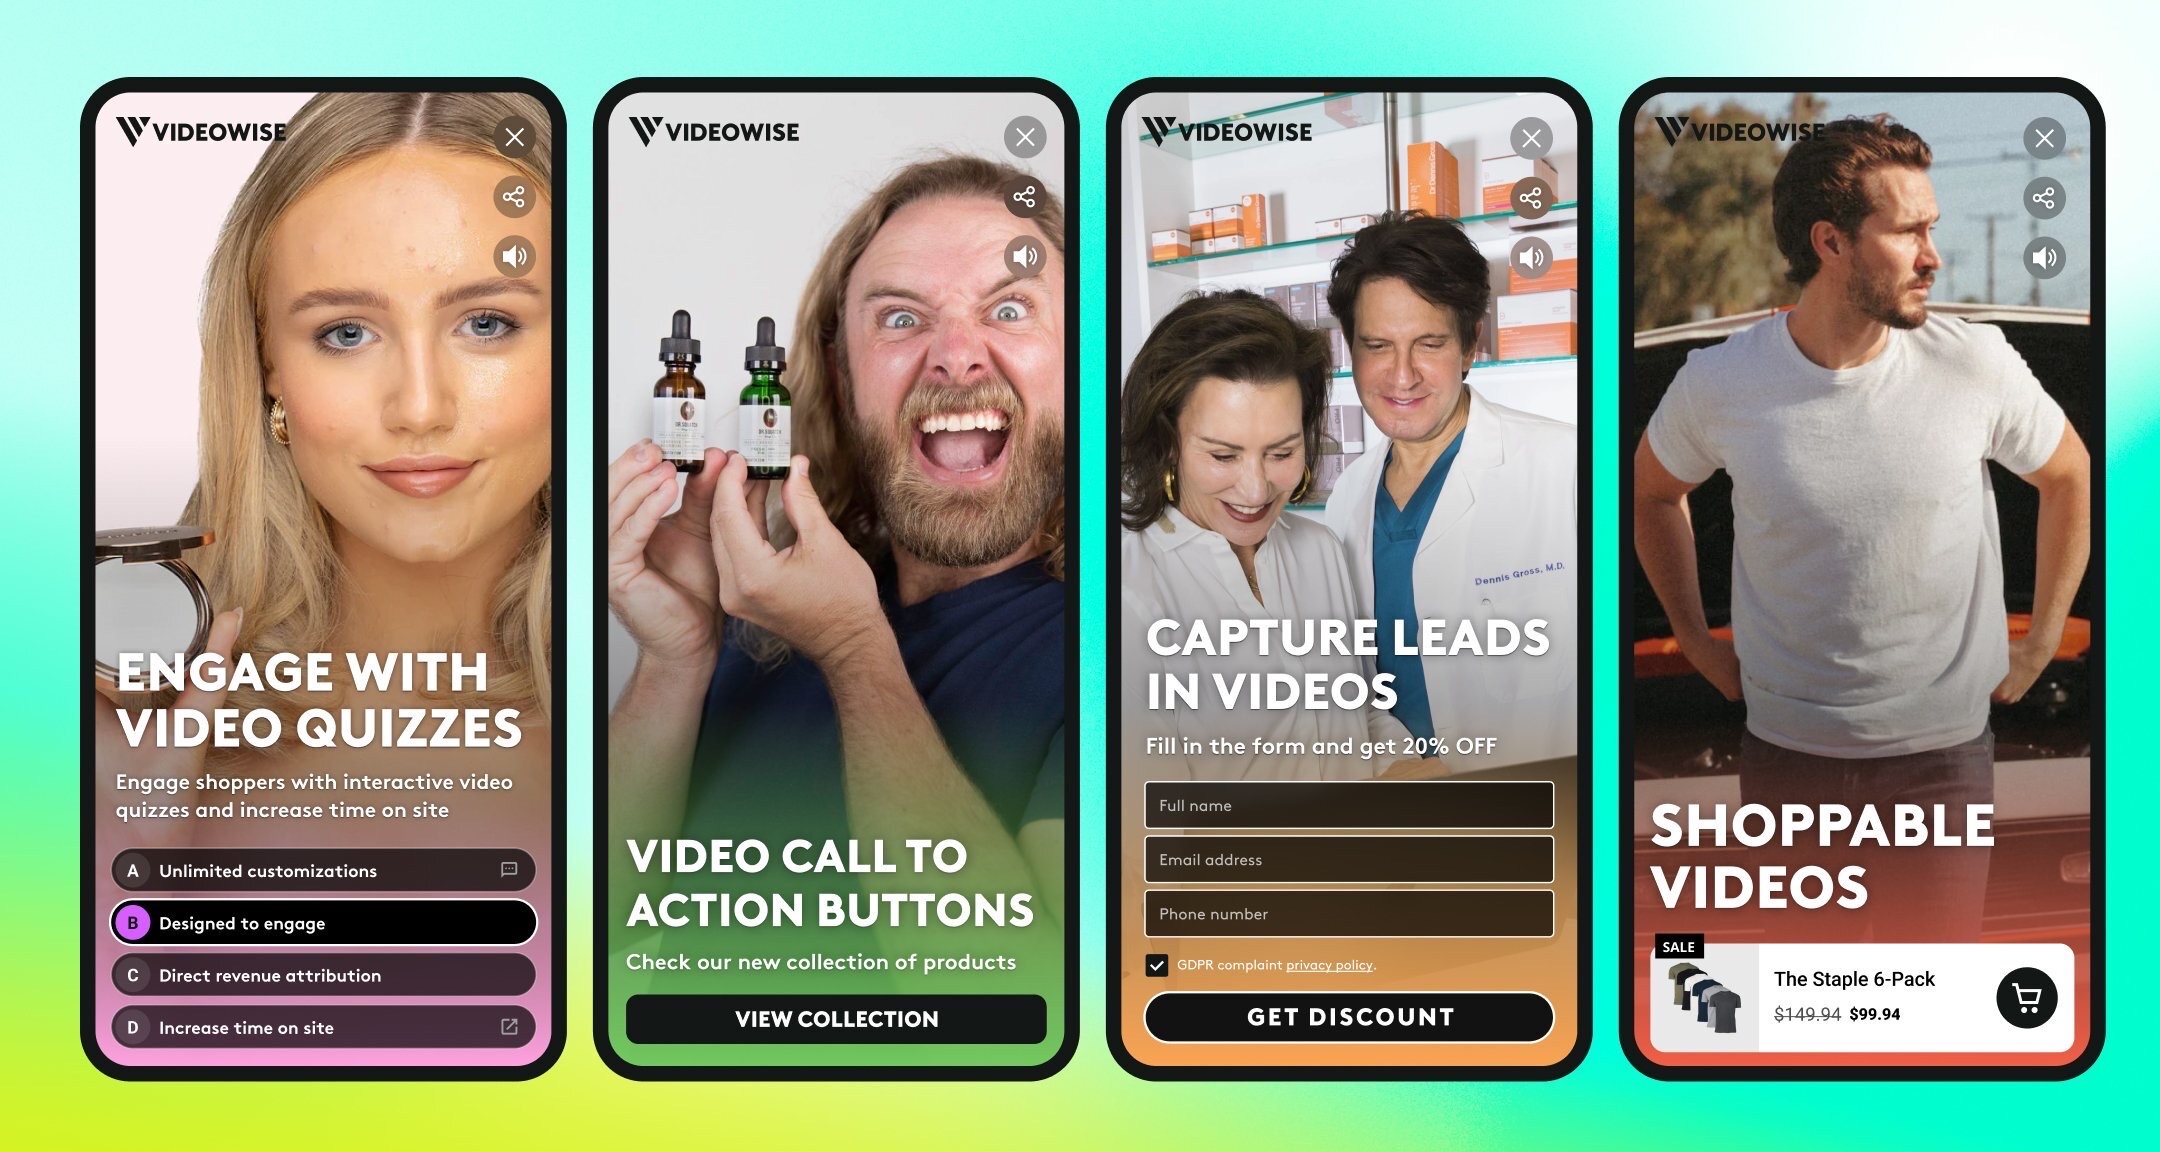
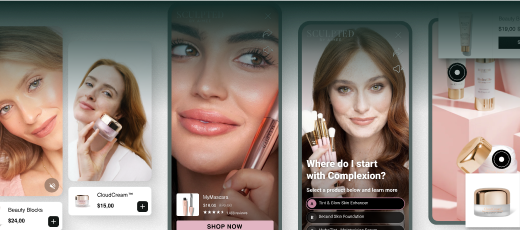
Whether you’re adding shoppable videos, user-generated content, or video quizzes, you can significantly increase revenue coming directly from video content. You need to strategically place these videos at crucial touch points within your store and on other channels, like social media platforms.
A tried-and-tested tactic is adding customer testimonials or UGC videos to the product page. This creates instant trust among first-time shoppers.
You can also add how-to videos to show your products in action and educate people about the best ways to use them. These videos are great for YouTube, Instagram, and TikTok as well. Convert them into the shoppable format, and viewers can instantly place an order.
A smooth and hassle-free checkout process is the key to unlocking higher conversions with videos. Regardless of where you embed videos, focus on simplifying the steps to place the order.
Did you know that at least 55% of shoppers buy on their phones during the BFCM season? It only makes sense for people to shop from their phones while they’re with family and friends instead of sitting on their laptops.
That’s why it’s crucial for eCommerce merchants to pay close attention to mobile + app performance during the retail holiday. You have to create responsive videos to engage mobile shoppers. Every interactive element—like a hotspot, a form, or a question—should fit neatly on smaller screens.
You should also design an intriguing thumbnail to pique shoppers' curiosity. Don't forget to add clear calls to action to each video and make them prominent enough in your videos to quickly catch viewers' attention.
Once everything's in place, test your video player across different screen sizes and make the necessary adjustments.
At its core, the success of your BFCM video marketing strategy depends heavily on how well you're engaging your target shoppers. The higher your customer engagement rate, the more orders you'll get and the deeper loyalty you'll earn.
Engaging shoppers during the retail holidays can be tricky, with so many brands vying for their attention. But you can stand out from the crowd with unique, buyer-centric campaigns.
You can offer exclusive discounts and early VIP access to customers in your loyalty program. On top of that, you can host contests to produce more user-generated content and reach a bigger audience through positive word-of-mouth.
Another surefire way to hype your shoppers is tapping into their fear of missing out. Show real-time stock updates and nudge people to buy quickly before the stocks run out.
Social media is a goldmine for eCommerce brands, especially during the peak season. You can maximize your reach and encourage product discovery among a broader audience.
Posting interactive videos on these platforms can also accelerate your conversion rate. If your videos are compelling enough, more and more users will click on the direct CTA of Shop Now and place an order.
Besides driving a healthy sales pipeline, you can also educate potential customers about your brand and products. Convey your brand’s story or showcase your best-selling products—interactive videos on social platforms can expose your content to a much larger audience than usual.
You can also leverage these platforms for community building and give all happy customers a space to share their reviews with others.
After months of hard work, your BFCM sale is live, and products are selling like hotcakes. But you soon realize you're almost out of stock for your best-selling products. Sounds like a nightmare, doesn't it?
If you don't want to find yourself in a messy situation like this, it's crucial to proactively track your inventory. Before the sale starts, leverage demand forecasting to analyze your order history and past BFCM performance. Then, evaluate demand trends and buying behavior to accurately predict demand.
You should also use an inventory tracking platform to get real-time updates on stock levels based on sales from every channel. As a best practice, keep a safety stock to tackle unexpected surges in demand.
You also need a robust logistics setup—both virtual workflows and physical transports—to get more stock and convert all the demand into sales.
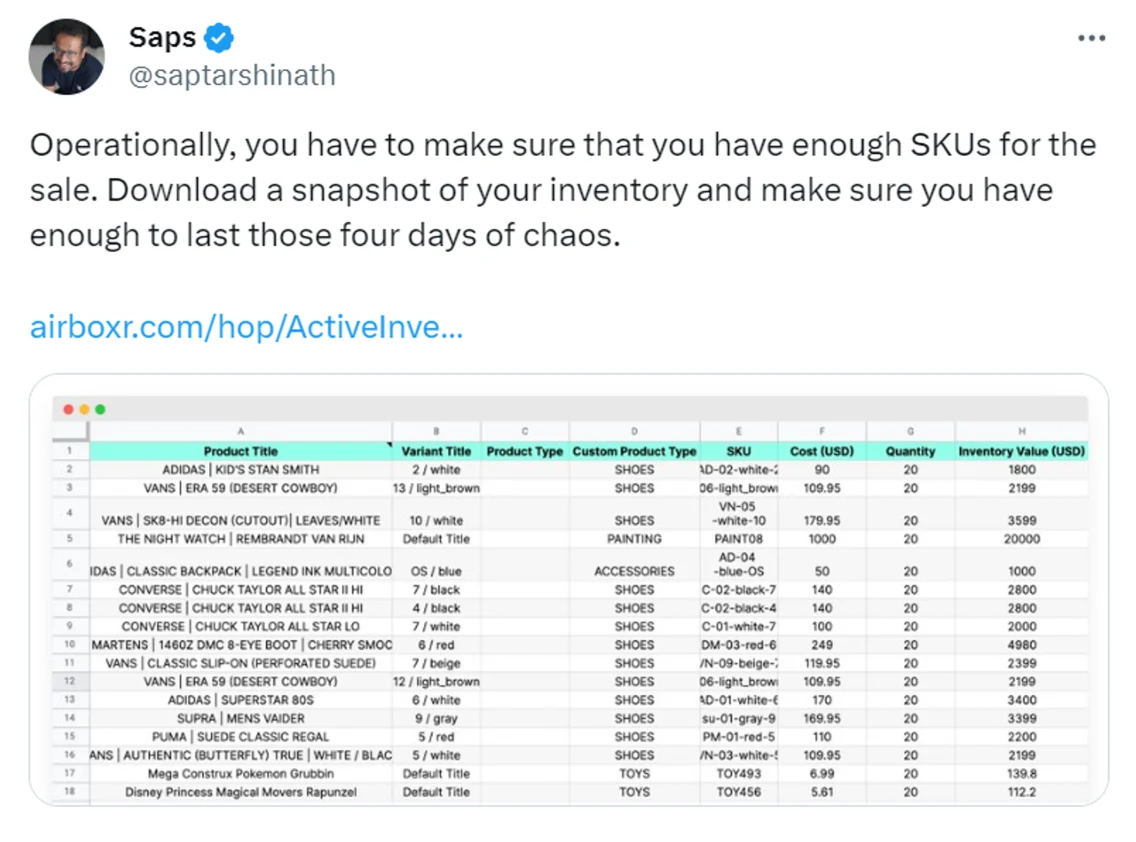
Sapartshi Nath, the founder of Airboxr, shared his playbook for regularly auditing inventory levels to avoid any last-minute panic.
The quality of your customer service can make or break your brand reputation. Think of good customer service as your trump card to set yourself apart in the peak shopping season when most eCommerce businesses are more focused on the hard sell.
Selling with empathy and servicing customer requests quickly can become key differentiators in your customer experience.
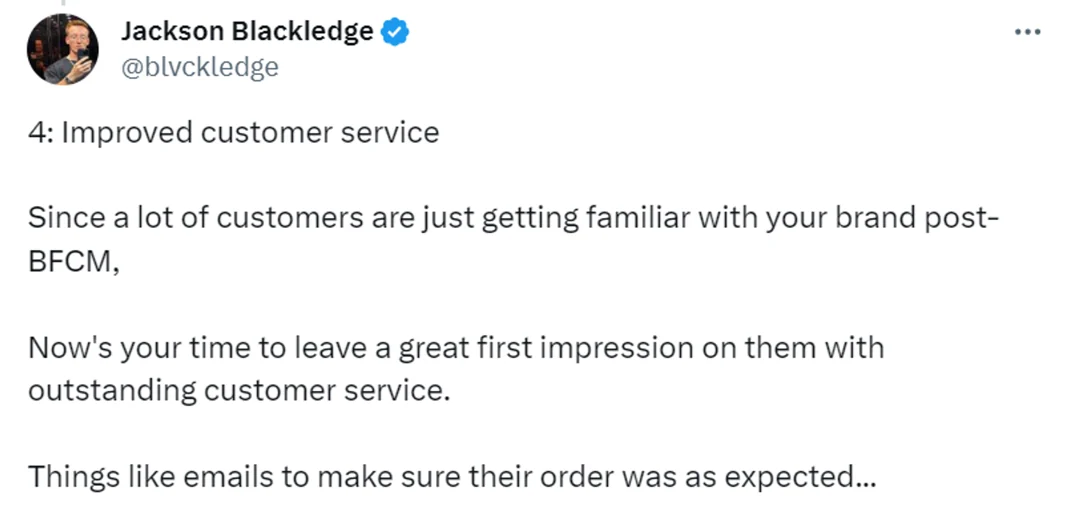
Not just that, Jackson Blackledge, the founder of an eCommerce ad agency, emphasized the importance of high-quality customer service after the BFCM frenzy. Once the storm has passed, you can establish a positive brand reputation by promptly responding to queries, sending warm emails, and more.
Another unmissable set of BFCM KPIs is the ones measuring the impact of your discounts and promotions. You should stay on top of your orders to identify which deals brought in the highest revenue and which didn't do so well.
In addition to tracking channel-specific metrics for discounts and promotions, keep a close eye on the impact of interactive videos. These videos can easily become one of your biggest revenue drivers, taking the best discounts to the right people to maximize ROI.
Email marketing is your direct channel to maintain an ongoing relationship with existing and potential customers. It serves multiple purposes, from engaging and activating shoppers to building brand awareness and driving sales.
Emails are a critical part of every eCommerce brand’s BFCM marketing recipe. But creating vibrant and visually appealing emails isn’t enough. You need accurate data to make informed decisions and drive real results.
When you embed interactive videos in your emails, the right metrics become even more important. You should get a pulse of your subscribers to see how many of them viewed the whole video, clicked on the CTA, or bounced.
In the run-up to the year's biggest retail holiday, don't forget to pick the right metrics for measuring the impact of all your hard work. Knowing what success looks like and which BFCM KPIs to measure from the start can save you a lot of struggle once the sale is underway.
Bookmark this comprehensive guide to give your BFCM marketing efforts a better direction. Monitor every aspect of your strategy with the metrics we’ve detailed here.
If you’re looking for the right analytics tool to track your interactive videos, Videowise can be your go-to tool. It creates a personalized dashboard to consolidate insights for all your videos and visualizes this data in graphs for easy understanding.
Interested to learn more? Book a demo to see how Videowise can level up your BFCM video marketing game.
The most important BFCM interactive video KPIs include video view rate, click-through rate on shoppable product tags, add-to-cart rate from video interactions, conversion rate on video-featured pages, revenue directly attributed to video, and return on video investment. Tracking these metrics shows exactly how video contributes to your BFCM sales.
Set up video KPI tracking by connecting your shoppable video platform (like Videowise) to your Shopify analytics, enabling UTM tracking on video-driven traffic, and setting up custom conversion events for video interactions in Google Analytics. This gives you a clear view of how video moves shoppers through your BFCM funnel.
Benchmarks vary by category, but interactive video typically converts at 2-5x the rate of standard product pages during BFCM when the shoppable experience is properly optimized. If your video click-through rate is above 10% and add-to-cart from video exceeds 5%, you are seeing strong results. Focus on improving these numbers through content and placement testing.
Standard video metrics measure passive engagement - views, watch time, and completion rate. Interactive video KPIs measure active behavior - clicks on product tags, cart additions, and purchases made within or immediately after the video. Interactive KPIs are more directly tied to revenue and are the metrics that matter most for BFCM performance.
After BFCM, analyze which videos had the highest click-through and conversion rates and identify what made them effective - was it the product type, video length, placement, or content style? Use these insights to brief your next season's video production. Brands that treat BFCM as a learning opportunity compound their video marketing results year over year.
9 crucial BFCM KPIs for measuring marketing performance
1. Analyze website traffic and sources
2. Stay on top of direct revenue coming from videos
3. Track mobile and app performance
4. Measure customer engagement and retention
5. Dig deeper into the buzz on social media
6. Optimize inventory and supply chain
7. Audit customer service performance
8. Map the impact of discounts and promotions
9. Track email marketing effectiveness


.jpg)
.jpg)
